Using AI to Detect Fraudulent Financial Transactions
Discover how AI-driven analytics are reshaping the finance sector, enhancing fraud detection accuracy, and optimizing financial operations with precision. Learn how Vizly revolutionizes this process by efficiently processing extensive financial datasets, enabling more informed decision-making and robust fraud prevention strategies.
Getting started
To begin analyzing financial data with Vizly, import your dataset into our platform. Vizly supports various data formats including CSV, Excel, or JSON, and can also import data directly from Google Sheets. For detailed instructions, visit our Getting Started guide.
For this example, we will use a credit card fraud dataset consisting of transactions by credit cards in September 2013 by European cardholders.
Detecting fraud
Initially, we can ask Vizly which features most strongly predict fraudulent transactions. This fundamental question sets the stage for focused and effective fraud detection.
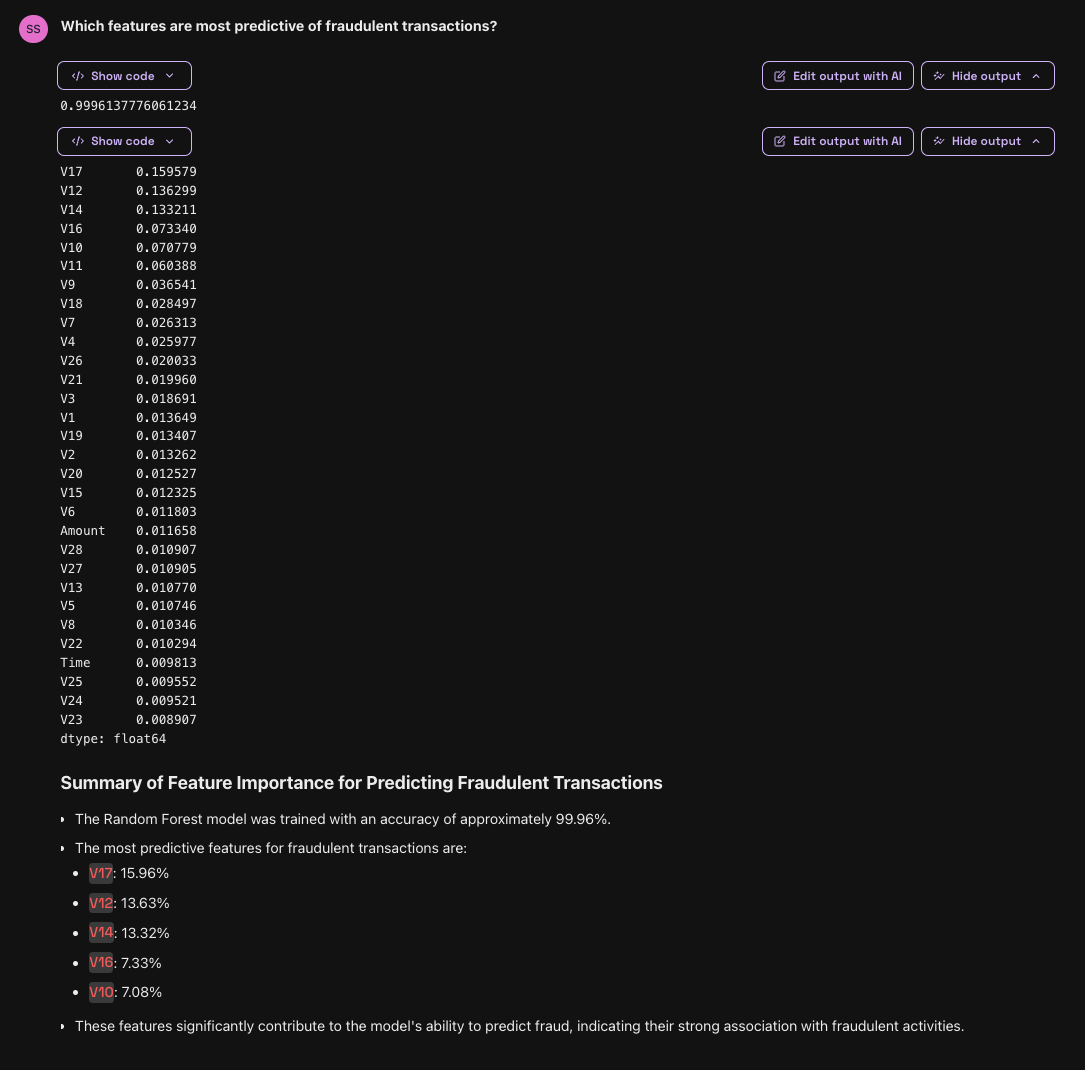
Vizly can identify feature importance in predicting fraudulent transactions.
The analysis was conducted using a Random Forest model and the most predictive features identified were:
- V17: 15.96%
- V12: 13.63%
- V14: 13.32%
- V16: 7.33%
- V10: 7.08%
These key features—particularly V17, V12, and V14—play a crucial role in predicting fraud, highlighting their strong association with fraudulent activities. Monitoring these standout predictors can refine fraud detection strategies, enhancing efficiency and minimizing false positives.
Leveraging this information, financial institutions can enhance their surveillance and fraud prevention mechanisms, thereby securing transactions and protecting consumer data more effectively.
Visualizing fraudulent transaction amounts
After we identified which features were most predictive of fraudulent transactions, we can ask Vizly to visualize the frequency of fraudulent transactions by transaction amounts.
Vizly can display an interactive visualization illustrating fraud occurrences by transaction amount.
This visualization chart reveals that fraudulent transactions primarily occur at lower amounts, likely targeted due to less scrutiny. Highlighting these can refine fraud detection algorithms to focus on these ranges, enhancing security and reducing fraud.
Conclusion
Vizly proves essential for financial professionals, simplifying complex data analysis and boosting insights into financial transactions, such as in fraud detection.
Try Vizly now© 2024 Squared Technologies, Inc.